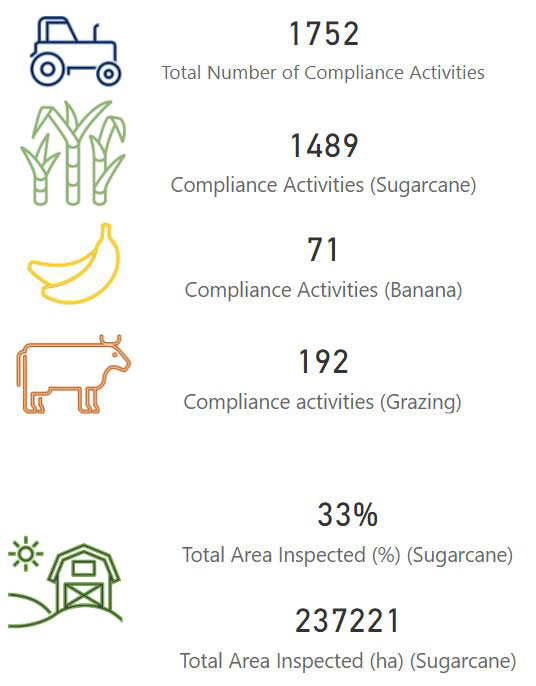
| Total numbers of compliance activities | 1752 |
| Compliance activities (Sugarcane) | 1489 |
| Compliance activities (Banana) | 71 |
| Compliance activities (Grazing) | 192 |
| Total area inspected (%) (Sugarcane) | 33% |
| Total area inspected (ha) (Sugarcane) | 237,221 |
| Initial compliance activities | 1067 |
| Follow-up compliance activities | 685 |
Compliance dashboard
Queensland’s environmental regulator, the Department of Environment, Science and Innovation (the department) assesses compliance with the Reef protection regulations.
The regulations include Agricultural Environmentally Relevant Activity standards for sugarcane and banana cultivation and beef cattle grazing.
The following dashboard details compliance data for the department’s inspection program of sugarcane and banana producers and graziers in the Great Barrier Reef catchment.
Before examining the data, it is important to consider the phased approach of the department’s compliance and enforcement strategy for the Reef protection regulations.
Compliance activity initially focused on education and awareness, supporting producers to understand their obligations and how to become compliant.
During these years of the program, revisit inspections were scheduled 12 months after the initial inspection.
If requirements were still not being met and rapid corrective action was not implemented by the producer, enforcement action, such as post-inspection letters requiring action on non-compliance, warning letters, statutory notices and penalty infringement notices, were used to require compliance.
On 1 December 2022, the full requirements of the Agricultural ERA Standards came into effect across all relevant Great Barrier Reef regions.
The approach to compliance inspections has subsequently changed, with a stronger regulatory response now being taken.
When an initial inspection determines that requirements are not being met, the producer is asked to implement corrective action.
If this action does not demonstrate compliance will be achieved, enforcement action including formal warnings and statutory notices, may be taken.
For revisits to producers who are consistently non-compliant, stronger enforcement action such as statutory notices and penalty infringement notes (fines) may be applied.
Data summary
Reflective of the phased implementation approach of the department’s compliance and enforcement strategy for Reef protection regulations, data for banana cultivation and cattle grazing is comparatively low when compared to sugarcane. This is because these two industries have been regulated for less time when compared to sugarcane.
The compliance results for sugarcane growing activities show that while the non-compliance rates are high at initial contact, most growers have taken steps and amended their farm practices voluntarily by the time the follow up visits occurs.
The results also show there is a large variation between basins.
Areas with known high water quality impacts are a priority for Reef protection regulation compliance inspections and the number of farms inspected in each basin will vary based on this.
Results of compliance activities (March 2016 – December 2023)

Farm area inspected by region (March 2016 – December 2023)
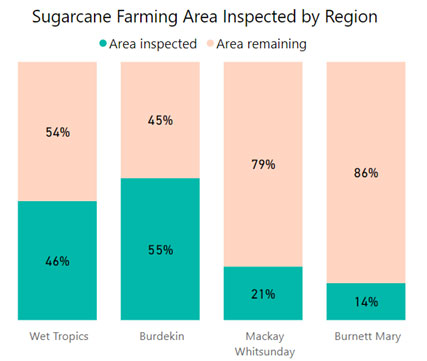
| Location | Sugarcane farming area inspected (ha) | Farming area remaining (ha) | % Farm area inspected | % Farm area remaining |
|---|---|---|---|---|
| Wet Tropics | 101849 | 118986 | 46 | 54 |
| Burdekin | 64582 | 52908 | 55 | 45 |
| Mackay Whitsundays | 54627 | 208834 | 21 | 79 |
| Burnett Mary | 16163 | 96769 | 14 | 86 |
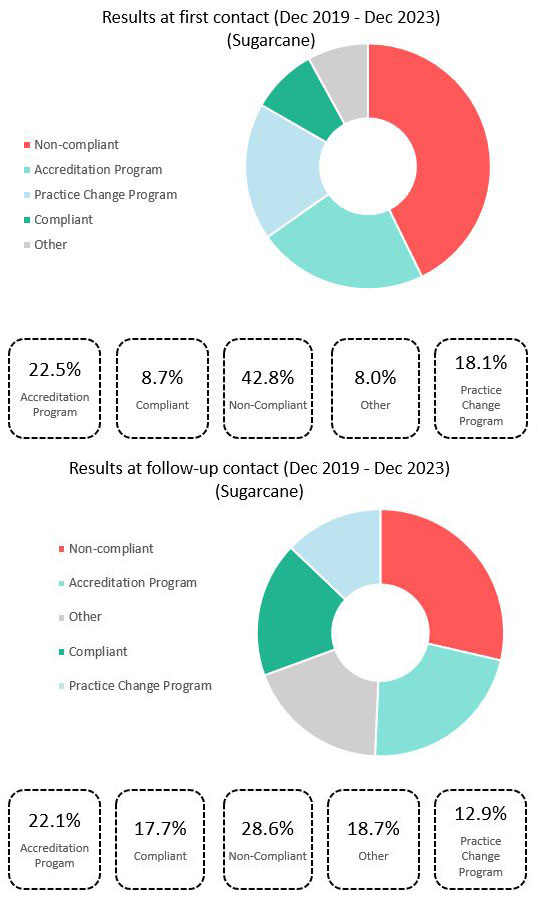
Results at first contact and follow-up for sugarcane (December 2019 – December 2023)
| Outcome | First contact |
|---|---|
| Non-compliant | 43% |
| Accreditation Program | 23% |
| Practice Change Program | 18% |
| Compliant | 9% |
| Other | 8% |
| Outcome | Follow-up contact % |
|---|---|
| Non-compliant | 29% |
| Accreditation Program | 22% |
| Other | 19% |
| Compliant | 18% |
| Practice Change Program | 13% |
These results show that while the non-compliance rates are high at initial contact, most growers have taken steps to amend their practices by the time the follow-up visit occurs.
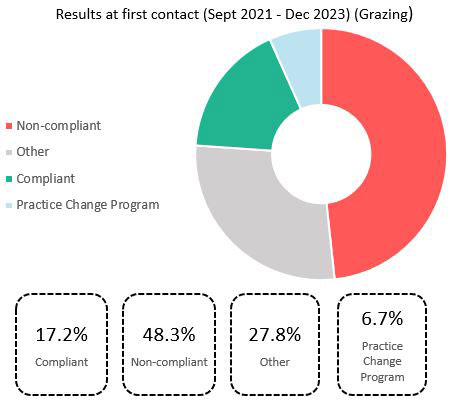
Results at first contact for grazing (September 2021 – December 2023)
| Outcome | First contact |
|---|---|
| Non-compliant | 48% |
| Other | 28% |
| Compliant | 17% |
| Practice Change Program | 7% |
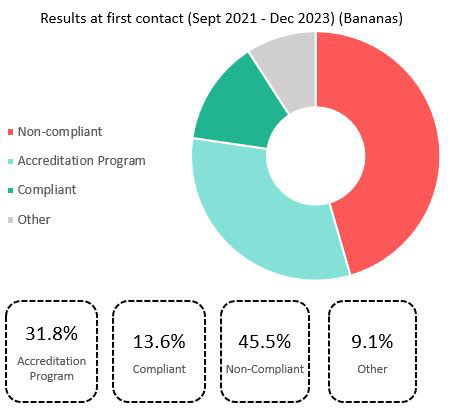
| Outcome | First contact |
|---|---|
| Non-compliant | 46% |
| Accreditation Program | 32% |
| Compliant | 14% |
| Other | 9% |
Basin Results
Sugarcane cultivation - compliance outcomes by river basin after first and follow up inspections of sugarcane farms since the compliance program commenced (March 2016 and December 2023)


Legend
- Non-compliant – Non-compliance identified, and enforcement action taken.
- Other – No longer farming.
- Practice Change program –Practice change program and deprioritized for inspection.
- Accredited program –Smartcane BMP or Freshcare Environmental accredited and deprioritized for inspection.
- Compliant – No non-compliances were identified at time of inspection.
| Location | Accreditation Program | Compliant | Non-compliant | Other | Practice Change Program |
|---|---|---|---|---|---|
| Barron | 33% | 8% | 25% | 8% | 25% |
| Burdekin | 6% | 15% | 49% | 5% | 25% |
| Haughton | 7% | 7% | 67% | 0% | 19% |
| Herbert | 20% | 7% | 57% | 1% | 16% |
| Johnstone | 18% | 5% | 29% | 1% | 47% |
| Mossman-Daintree | 13% | 8% | 54% | 1% | 25% |
| Mulgrave-Russell | 23% | 14% | 48% | 1% | 13% |
| O'Connell | 9% | 9% | 66% | 8% | 9% |
| Pioneer | 11% | 6% | 64% | 6% | 14% |
| Plane | 8% | 12% | 67% | 2% | 11% |
| Proserpine | 5% | 11% | 81% | 3% | 0% |
| Tully-Murray | 31% | 8% | 33% | 1% | 27% |
| Location | Accreditation Program | Compliant | Non-compliant | Other | Practice Change Program |
|---|---|---|---|---|---|
| Wet Tropics | 23% | 8% | 43% | 1% | 25% |
| Mackay
Whitsunday | 8% | 10% | 68% | 5% | 9% |
| Burdekin | 7% | 12% | 56% | 2% | 23% |
| Location | Accreditation Program | Compliant | Non-compliant | Other | Practice Change Program |
|---|---|---|---|---|---|
| Barron | 50% | 10% | 10% | 20% | 10% |
| Burdekin | 10% | 29% | 25% | 18% | 18% |
| Haughton | 9% | 24% | 38% | 7% | 22% |
| Herbert | 7% | 23% | 44% | 13% | 13% |
| Johnstone | 33% | 17% | 31% | 7% | 12% |
| Mossman-Daintree | 17% | 10% | 55% | 4% | 14% |
| Mulgrave-Russell | 19% | 13% | 32% | 21% | 15% |
| O'Connell | 16% | 19% | 30% | 19% | 16% |
| Pioneer | 24% | 33% | 24% | 14% | 5% |
| Plane | 22% | 22% | 18% | 10% | 28% |
| Proserpine | 11% | 32% | 29% | 11% | 18% |
| Tully-Murray | 42% | 7% | 28% | 5% | 18% |
| Location | Accreditation Program | Compliant | Non-compliant | Other | Practice Change Program |
|---|---|---|---|---|---|
| Wet Tropics | 24% | 15% | 36% | 11% | 14% |
| Mackay
Whitsunday | 19% | 24% | 24% | 13% | 20% |
| Burdekin | 9% | 27% | 31% | 13% | 20% |
These results show there is large variation between basins. The Johnstone River basin has the lowest rates of non-compliance with the highest rates of involvement in a practice change program or best management practice accreditation. The highest rates of non-compliance are in the Haughton, Herbert and Mossman-Daintree River basins, and the river basins within the Mackay Whitsunday region.
Beef cattle grazing - compliance outcomes by river basin at last contact for activities since the compliance program commenced (December 2019 to December 2023).
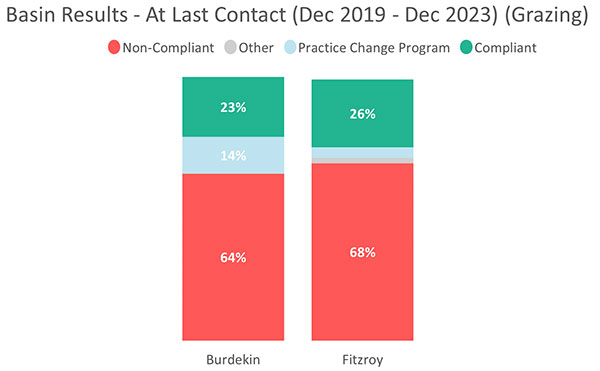
| Location | Compliant | Non-compliant | Practice Change Program | Other |
|---|---|---|---|---|
| Burdekin | 23% | 64% | 14% | 0% |
| Fitzroy | 26% | 68% | 4% | 2% |
Banana cultivation - compliance outcomes by river basin at last contact for since the compliance program commenced (December 2019 to December 2023)
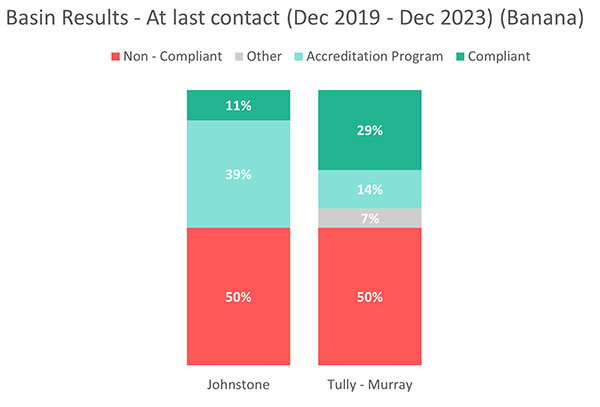
| Location | Accreditation Program | Compliant | Non-compliant | Other |
|---|---|---|---|---|
| Johnstone | 39% | 11% | 50% | 0% |
| Tully-Murray | 14% | 29% | 50% | 7% |


