


2022–23 SLATS Report
Statewide overview
Key findings
- At the end of the 2022–23 monitoring period, Queensland had 94,928,709ha of woody vegetation. This represents a net reduction of 186,694ha in the extent of the state’s woody vegetation for the monitoring period.
- At the start of the 2022–23 monitoring period, Queensland had 95,115,403 hectares (ha) of woody vegetation with greater than 10% crown cover. This is about 55% of Queensland’s land area.
- In the 2022–23 monitoring period, 332,015ha of woody vegetation was affected by clearing activity. This is a 3% increase in clearing activity from 2021–22 (323,676ha) but less than the annual totals reported for the monitoring periods from 2018–19 to 2020–21.
- Of the total clearing activity, 271,343ha (82%) resulted in full removal of the woody vegetation. This is a slight increase of 1% in full clearing from 2021–22. The remaining 60,672ha of clearing activity in 2022–23 was partial clearing.
- In the 2022–23 monitoring period, 84,649ha of new regrowth was mapped.
Clearing activity
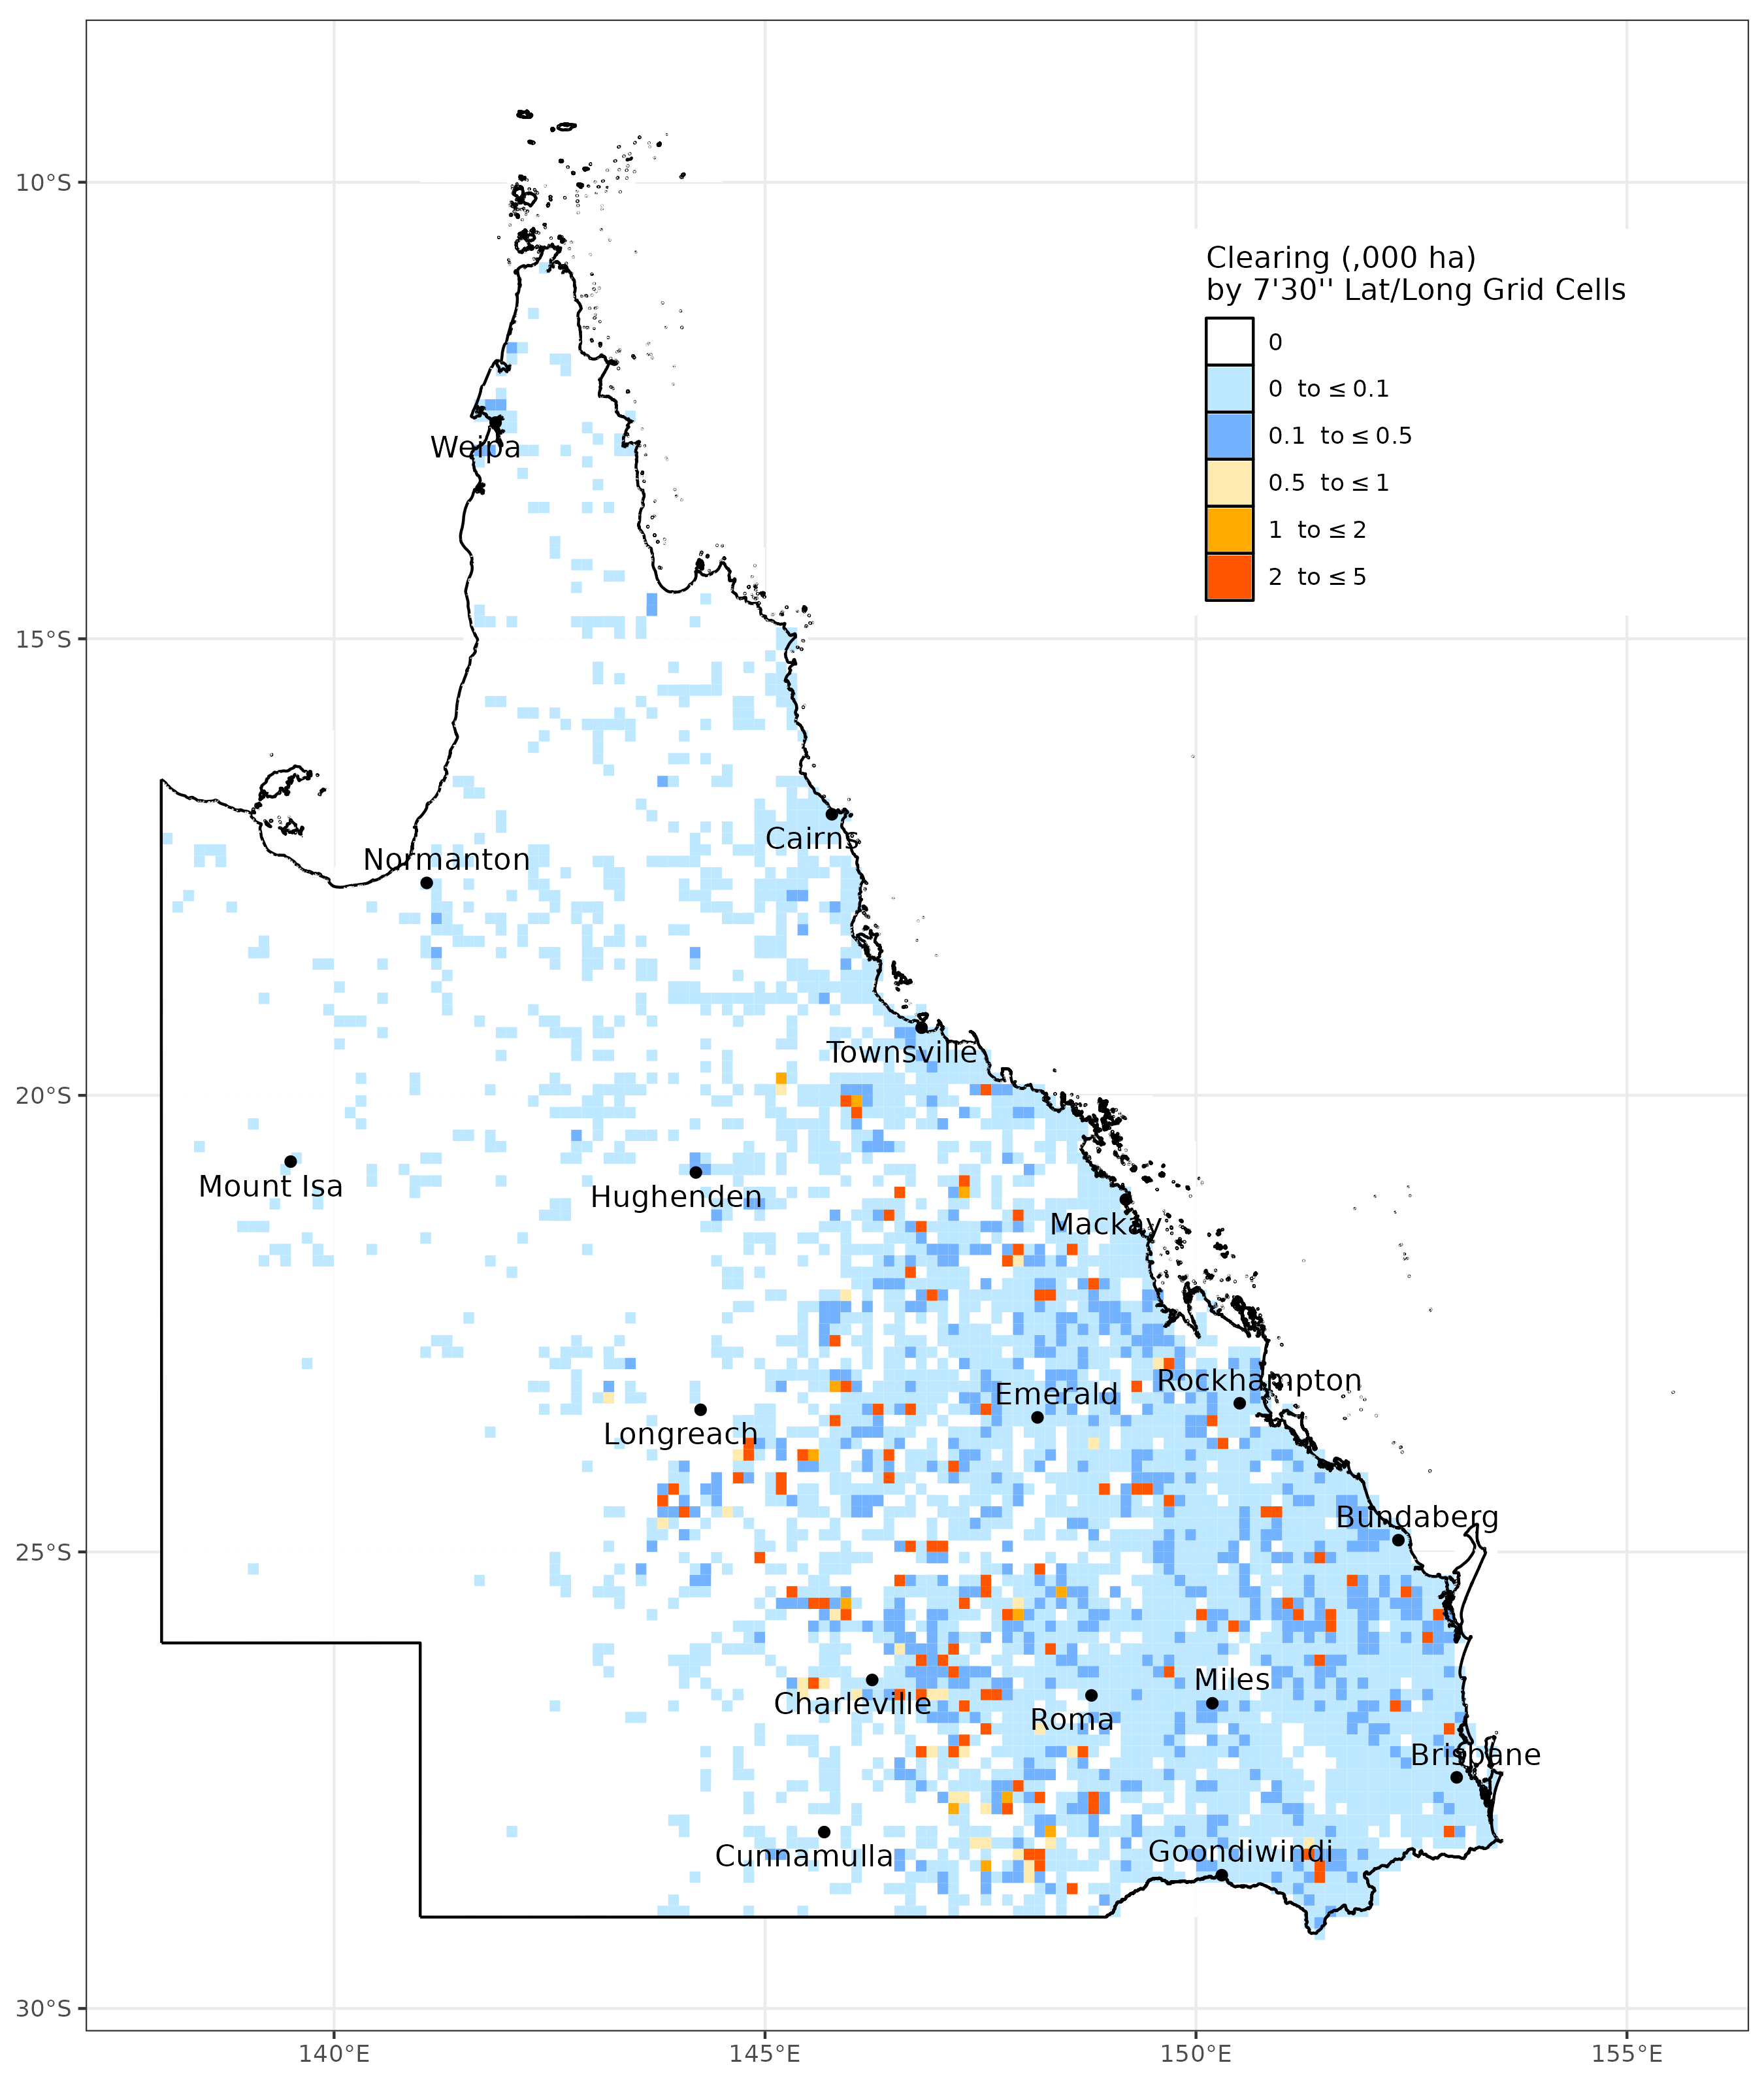
A total of 332,015ha of woody vegetation was affected by clearing activity in 2022–23. This is a 3% increase in clearing activity from 2021–22 (323,676ha) but less than the annual totals reported for the years from 2018–19 to 2020-21. Of the total clearing activity, 82% (271,343ha) resulted in full removal of the woody vegetation. The remaining 60,672ha of clearing activity was partial clearing.
Clearing activity in Queensland can be undertaken in many ways. This can include mechanical removal or modification of the woody vegetation, forestry activities (e.g. selective harvesting), treatment with herbicides, or a combination of these approaches. Sometimes fire is also used or accompanies other methods. SLATS uses a range of data sources, particularly high-resolution satellite imagery and field-based observation to help verify that clearing has been undertaken. These manual verification and mapping steps are essential for ensuring an accurate representation of woody vegetation change in Queensland.
For more detailed breakdowns of clearing activity in the 2022–23 monitoring period, refer to the Statewide breakdown.
Clearing activity 2018–19 to 2022–23
Area of clearing activity from 2018–19 to 2022–23.
- Full clearing refers to areas which have been converted from woody to non-woody (i.e. less than 10% crown cover remains).
- Partial (major) are clearing areas where the woody vegetation has been significantly modified but remains woody (i.e. greater than 10% crown cover remains but more than 50% of the area has been affected by the clearing).
- Partial (minor) are clearing areas where some modification of the woody vegetation has occurred, remaining woody (i.e. greater than 10% crown cover remains but less than 50% of the area has been affected by the clearing).
Spatial distribution of clearing activity 2022–23
Regrowth
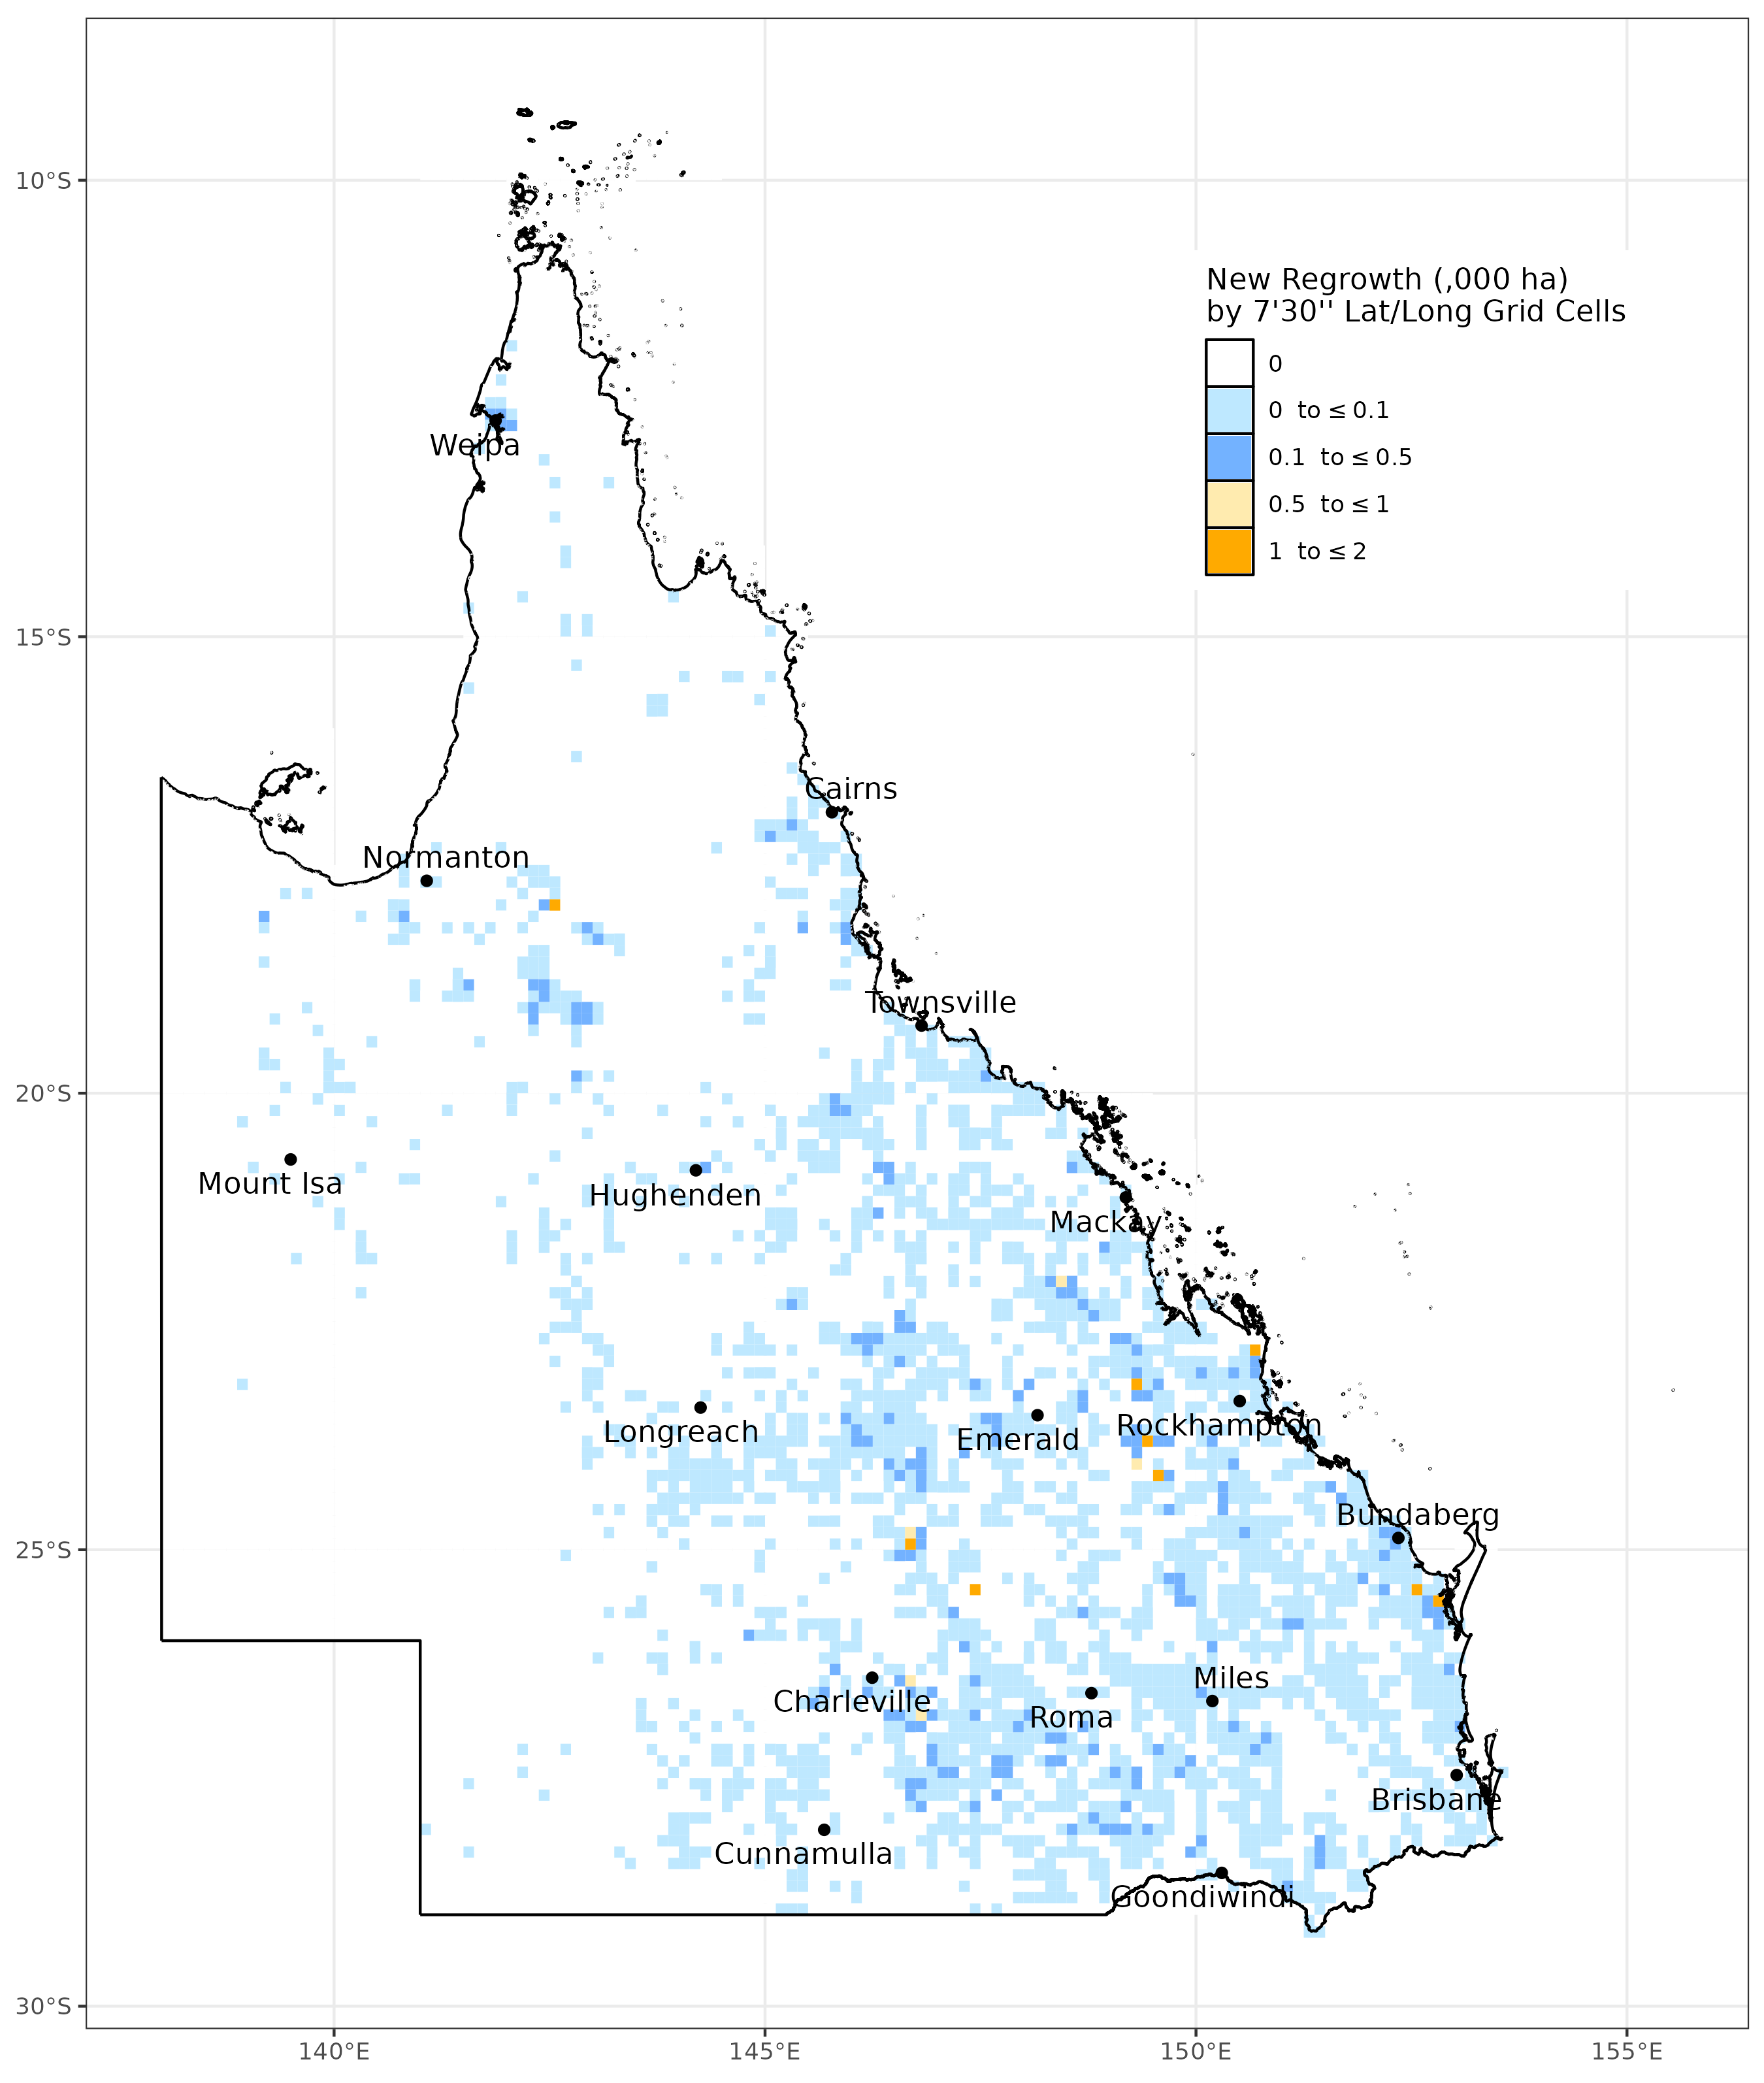
In the 2022–23 monitoring period, 84,649ha of new regrowth was mapped. This is a significant increase in the amount of new regrowth added for the state compared to previous years.
A range of factors contribute to new regrowth being detected and mapped. Increased availability of very high-resolution satellite imagery, longer time-series, and advances in classification techniques continue to improve regrowth mapping capabilities. There are also natural and land management factors. Seasonal and longer-term rainfall patterns are a key driver. In general, there were some wetter years in the early 2020’s following several dry years leading up to around 2019–20. This can lead to woody vegetation recruitment and regrowth. It is also possible that with the decreases in clearing activity since about 2017–18, more woody vegetation has had the opportunity to regrow without being re-cleared. Another longer-term factor is changing fire regimes which, when combined with variable climate patterns, has led to increases in woody vegetation in areas such as the Gulf Plains Cape York Peninsula bioregions. Some incentive-based programs such as environmental offsets, carbon projects, and/or rehabilitation areas such as those around mines, may also be contributing to new regrowth areas. Trends in regrowth are difficult to surmise from SLATS mapping due to the varying contributing factors and timeframes that lead to regrowth becoming sufficiently woody to be detected and mapped. For more detailed breakdowns of regrowth in the 2022–23 monitoring period, refer to the Statewide breakdown.
Regrowth 2019–20 to 2022–23
Area of new regrowth from 2019–20 to 2022–23.
- Regrowth are new woody vegetation areas which have regrown sufficiently to be added to the SLATS woody extent. Regrowth was not reported in 2018–19.
Spatial distribution of regrowth 2022–23
Woody vegetation extent change
From a starting balance of 95,115,403ha, 271,343 ha was subtracted for full clearing and 84,649ha was added for new regrowth. At the end of the monitoring period, Queensland had 94,928,709ha of woody vegetation. This represents a net reduction of 186,694ha in the extent of the state’s woody vegetation.
While these figures represent a net reduction in woody vegetation extent, it is important to acknowledge that not all vegetation change is equal. For example, clearing in remnant areas cannot be directly compared with clearing in non-remnant areas in terms of the impacts on biodiversity, carbon or landscape function. Similarly, new regrowth does not offset remnant loss.
Transaction summary 2022–23
| Category | Gain (ha) | Loss (ha) | Balance (ha) |
|---|---|---|---|
| Opening balance August 2022 | - | - | 95,144,345 |
| Adjustment | 5,494 | -34,436 | 95,115,403 |
| Crop | 1,401 | -2,668 | 95,114,135 |
| Forestry | 5,945 | -6,910 | 95,113,171 |
| Infrastructure | 26 | -2,879 | 95,110,317 |
| Mine | 1,758 | -6,638 | 95,105,437 |
| Pasture | 75,431 | -250,777 | 94,930,091 |
| Settlement | 88 | -1,470 | 94,928,709 |
| Closing balance August 2023 | - | - | 94,928,709 |
This transaction summary shows the opening balance of woody vegetation at the start of the 2022–23 monitoring period, the losses due to clearing activity that resulted in the full removal of the woody vegetation, and the gains due to new regrowth, for each landcover replacement class. A closing balance at the end of the 2022–23 monitoring period is provided.
Loss and gain adjustments are made to correct for areas in the SLATS woody extent that have been identified in the 2022–23 monitoring period as areas that are not woody or were woody and missed in the original SLATS baseline (or subsequent updates to the baseline). This is expected as additional imagery becomes available to be able to verify woody and non-woody areas. The adjustments ensure the woody extent is maintained to be as accurate as possible based on the available imagery. Note that any natural changes that result in a full and persistent removal of woody vegetation are included in the loss adjustment. This includes woody vegetation removal from landslides, and some areas of flood and cyclone damage. It does not include fire-related loss as this is considered a temporary loss.
Re-processing of the woody vegetation extent at the conclusion of each SLATS monitoring period to incorporate the new clearing and regrowth mapping data can lead to minor differences between previously reported figures and figures presented in this report. This is mostly due to data filtering and cleansing operations, as well as the conversion of the data to raster for reporting. This difference can be most apparent in the transaction summary where the woody vegetation extent closing balance of the previous monitoring period may not be identical to the opening balance of the current monitoring period. These differences equate to a fraction of one percent difference in the total extent of woody vegetation in Queensland that is estimated by SLATS.
In this guide:
- Previous ( https://oss-uat.clients.squiz.net/environment/land/management/mapping/statewide-monitoring/slats/slats-reports/2022-23-slats-report/key-findings )
- Next ( https://oss-uat.clients.squiz.net/environment/land/management/mapping/statewide-monitoring/slats/slats-reports/2022-23-slats-report/statewide-breakdown )