Annual report for local government activities under the Food Act 2006

The 2023-24 Annual report for local government activities under the Food Act 2006 provides information on food regulatory activities under the Food Act 2006 (Food Act) undertaken by local governments in Queensland for the 2023-24 financial year.

Key findings from the report can be viewed on the interactive dashboard Key Findings - 2023-24 Local government reporting.

Local Government Areas (LGAs)

In Queensland, there are 77 local governments and one Town Authority (Weipa), which is administered by the mining company Rio Tinto. The Weipa Town Authority acts in the role of a Local Authority, with staff that would normally be associated with a local government. Therefore, for the purposes of this report, Weipa Town Authority is considered as a local government.

Download a map of local government areas.

Half of Queensland local governments have a population of over 10,000, including Brisbane City Council, which houses approximately one quarter of the Queensland population. Accordingly, there is major variation in the distribution of food businesses, the capacity of local governments and other factors that may limit regional comparisons.

Targeted compliance and regulatory actions undertaken by local governments are determined by local priorities and are not prescribed by the State. This provides local government with the discretion to target regulatory compliance activities within their boundaries and contributes to the variation in food safety compliance activities between local governments.

Report methodology

The methodology for collecting the data consists of a self-reporting survey that may be subject to misclassification or user error. While care has been taken to clarify potential data discrepancies, some errors may not be easily identified and may therefore remain.

Report limitations

While this report provides activity data on select types of regulatory action undertaken, it does not include a full range of strategies and tools (such as voluntary food safety training and educational/promotional food safety strategies) that regulators may use to assist and engage with food businesses to achieve and maintain compliance with the Food Act.

The data also does not take into account that inspection, complaint and enforcement activity data may include food businesses that do not require a licence.

|

Licensed food businesses

There are 32,916 licensed food businesses throughout Queensland.

A total of 71 local governments had at least one licensed food business, unchanged since the 2022-23 reporting period.

Compliance rates

The compliance rate for licensed food businesses to have a food safety supervisor was 93%, slightly lower than the last reporting period (97%).

The compliance rate for licensed food businesses with the requirement for them to have an accredited food safety program was 99%, consistent with the previous six reporting periods.

Full-time equivalent (FTE) employees and inspection rates

Routine inspections were undertaken for approximately three-quarters of licensed food business (not including food complaint-related inspections), a decrease of 8.4% from 2022-23.

A total of 5,085 complaints were received by local governments regarding licensed food businesses, representing a 19% increase from 2022-23 (4,281). Food business inspections (2,765) were undertaken for 54% of food complaints, an increase from the inspection rate of 44% in 2022–23.

Statewide, there were approximately 163 employees committed to food regulation for the 2023–24 reporting period, which is approximately one employee per 200 licensed food businesses, an 18% decrease from 2022–23 (198).

A total of 41% (29) of local governments with licensed food businesses reported that they use contractors. This is a small decrease from 2022–23, where 43% (31) of local governments with licensed food businesses used contractors to perform some food regulation tasks.

Enforcement activity

Type of action2022-232023-24 Change between years
Improvement Notices 2,908 2,8342.5% decrease
Prescribed Infringement Notices (PINs) 421 486 15% increase
Show cause notices issued1079412% decrease
Licence suspensions following show cause process4944% increase
Licence cancellations following show cause process41060% increase
Immediate licence suspensions 55 59 7% increase
Prosecutions 42 47 12% increase

Certain food businesses are required to be licensed by local governments under the Food Act, including:

  • food manufacturers (e.g. manufacturers of bakery products)
  • food businesses selling unpackaged food by retail (e.g. restaurants or catering businesses)
  • non-profit organisations that sell meals on at least twelve occasions in a year (e.g. Meals on Wheels).

Licensing exemptions

Some licensing exemptions apply under the Food Act to food businesses in these general categories, including (but not limited to):

  • the sale of pre-packaged food only
  • the sale of whole fruit and vegetables or drinks such as tea, coffee, soft drink and alcoholic beverages
  • primary producers of eggs, dairy, meat, seafood and specified horticulture that are accredited by Safe Food Production Queensland under the Food Production (Safety) Act 2000.

Licence locations around Queensland

The number of licensed food businesses in Queensland was 32,916, similar to 2022-23 (31,790).

Of 8,461 licence applications received during the reporting period, 70% (50) of local governments reported that all licence applications received were processed in accordance with legislated requirements including timeframes.

Of the 78 local governments, the following seven local governments reported more than 1,000 licensed food business, representing 66% (21,651) of licensed food businesses statewide:

  • Brisbane City Council - 7,743
  • Gold Coast City Council - 5,846
  • Sunshine Coast Regional Council - 2,200
  • Moreton Bay Regional Council - 1,985
  • Logan City Council - 1,620
  • Cairns Regional Council - 1,196
  • Townsville City Council - 1,061.

A total of seven local governments reported having no licensed food businesses, unchanged since 2022-23. An additional thirteen local governments reported having less than ten licensed food businesses, one more than 2022-23.

The annual trend in the number of licensed food businesses is represented in the figure below.

The total number of licensed food businesses in Queensland increased steadily from 24,076 in 2011 to 32,427 in 2020. It declined in 2021 and 2022 and currently sits at 31,790.

Food business categorisation

Categorising food businesses can allow local governments to prioritise food safety tasks such as inspections, which can assist with planning and ensuring that adequate resources are available.

Local governments were asked to specify their primary method of categorising of licensed food businesses from a set list and the results are listed below and shown in Figure 2.

  • Risk profiling framework (e.g. priority 1 - priority 4)
  • Simple risk-based (high, medium, low)
  • Business type (restaurant, childcare, etc.)
  • Business function (temporary, mobile, fixed etc.)
  • Business size (e.g. floor size etc.)
  • No category used
  • Other

The reporting identifies the two most common methods as business type and simple risk-based, consistent with the previous three reporting periods.

Note: Combination represents where local governments specified that more than one categorisation method is used.

Food safety compliance rate

Food safety supervisors

Compliance with the requirement for licensed food businesses to have a nominated food safety supervisor has been steadily increasing over time, as shown in the figure below, however it is slightly lower (93%) than the compliance rate in 2022–23 (97%).

Bar chart showing an upwards trend in the number of licensed food businesses with food safety supervisors plotted alongside the total number of food businesses.

Food safety programs

Under the Food Act, certain high-risk licensed food businesses are required to have a food safety program (FSP) accredited by their local government if:

  1. the food business involves off-site catering
  2. the primary activity of the food business is on-site catering
  3. the food business is undertaken as part of the operations of a private hospital
  4. a facility that processes or serves potentially hazardous food to six or more vulnerable persons (e.g. childcare and aged care centres)
  5. a facility whose principal activity is processing ready-for-consumption food that includes potentially hazardous food, for delivery by a delivered meals organisation to six or more persons at a time.

The compliance rate for relevant food businesses to have a food safety program has been consistently high, at a rate of 99% compliance over the past six reporting periods.

There were 2,779 high-risk food businesses requiring an accredited FSP. The number of food businesses with an accredited FSPs that were audited by an approved auditor during the reporting period was 84% (2,346) of the total, similar to 2022-23 (2,324 audited FSPs).

Food businesses’ compliance with accreditation and auditing requirements for this reporting period compared to the previous reporting period is shown in the figure below.

The line in the chart shows a general increase in food safety program compliance from 2011-12 to 2022-23, with a slight lower dip during 2017-18.

Local governments inspect licensed food businesses to assess compliance with the Food Act, the Food Safety Standards (Chapter 3 of the Food Standards Code) and the licence conditions of the food businesses. The Food Act does not specify the frequency of inspections.

Local governments conduct routine inspections based on factors such as the risk category of the food business (e.g. high, medium or low) and the compliance history of the business. The frequency of inspections may also provide an indication of a local government’s capacity to assess compliance of a food business with their legislative requirements in relation to food safety.

The number of annual inspections undertaken (28,806) decreased by approximately 8% from 31,367 in 2022-23. A representation of the type and number of inspections undertaken annually is provided in the figure below.

The chart shows that inspections and routine inspections went up from last period and re-inspections remained consistent. The number of inspections is not as high as 2018-19.

Investigating food safety complaints

Local government receive a variety of complaints from the public regarding unsafe practices at food businesses or regarding food purchased. Some examples of complaints include dirty or unhygienic food premises, undercooked food, poor food handling practices, vermin or animals in a food premises and alleged foodborne illness. The number and type of complaints received can vary greatly.

Local governments were requested to provide the total number of complaints about food businesses that they received during the reporting period. They were not asked to categorise these complaints due to the complexities associated with varying data collection methodologies within individual local governments.

Since 2018-19, complaints received annually about food businesses have been steadily increasing (Figure 4). During this reporting period, 5085 complaints were received, which is an increase of approximately 19% from 2022–23 (4,281).

The number of complaint-related inspections undertaken compared with the number of complaints received provides an indication of whether complaints are being investigated via food business inspections. For this reporting period, inspections were undertaken for 44% (1,893) of food complaints, a significant decrease from the inspection rate of 78% (2,948) for 2021-22.

A total of 44 local governments reported that data is collected relating to compliance of initial complaint-based inspections. For these local governments, the compliance rate was approximately 20%.

The number of complaints and complaint-related inspections over time is shown in the figure below, noting that complaint-related inspection data for the reporting periods prior to 2014-15 is unavailable.

The chart shows complaints are currently at their highest level and have increased since 2020-21. Complaint-related inspections have gone down since last period.

The Food Act provides a suite of enforcement options. The enforcement action taken by a local government should be graduated and proportionate to the severity of the non-compliance observed and any history of non-compliance. When considering enforcement data, it is important to note that in addition to enforcement actions, local governments use non-punitive actions such as education to assist food businesses achieve or maintain compliance with the Food Act. This report does not capture information from local governments in relation to other strategies used.

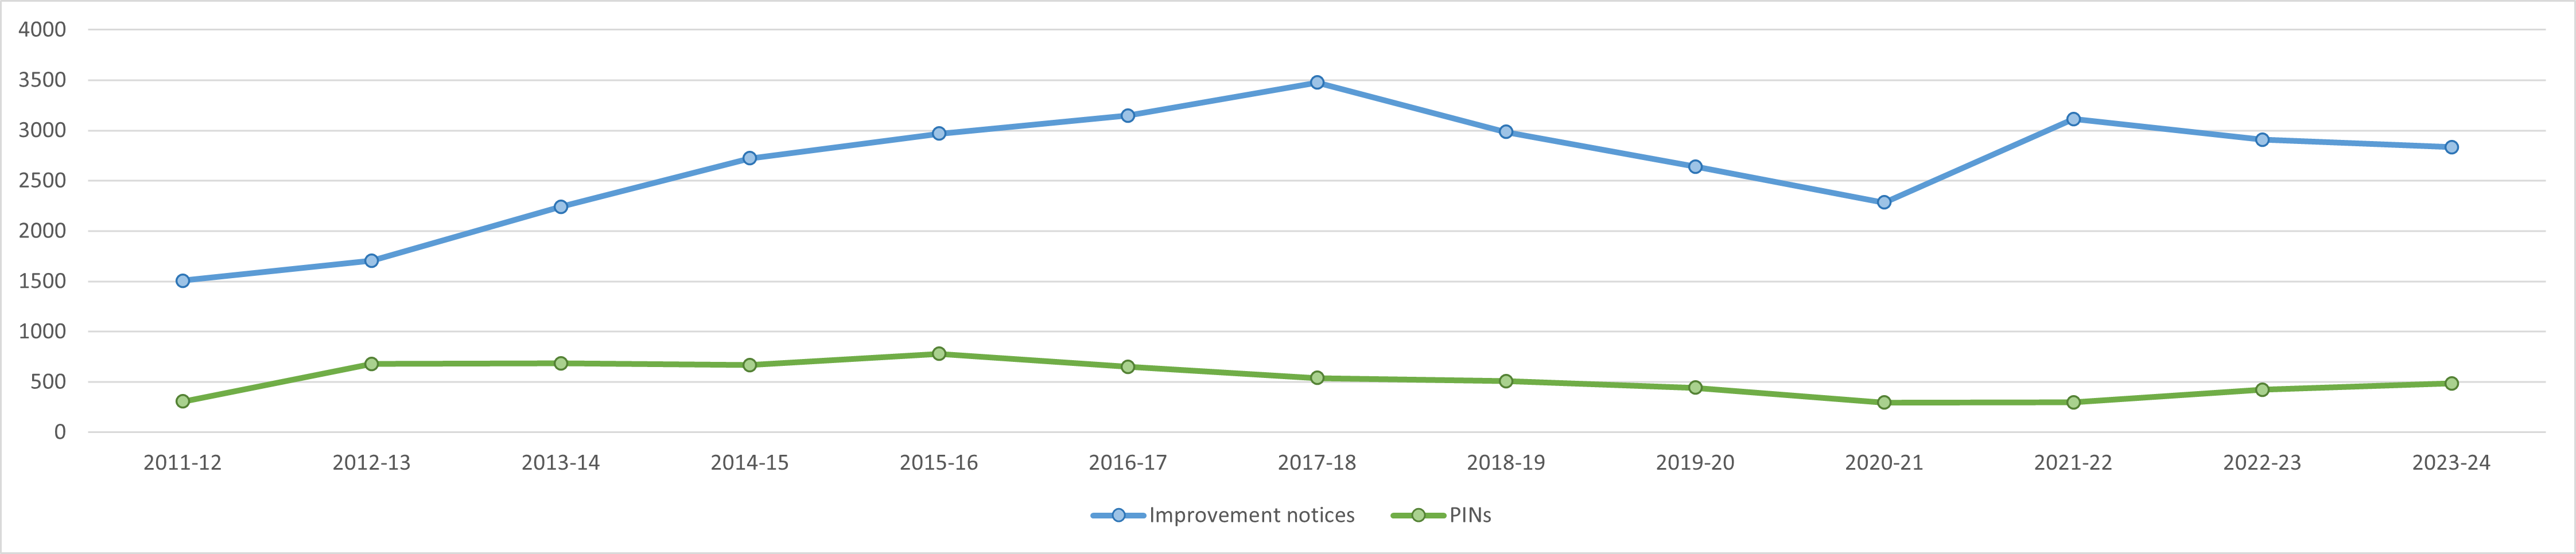
Consistent with previous years, the main type of enforcement activity undertaken by local government was the issuing of improvement notices, followed by prescribed infringement notices (PINs) as the second most common enforcement tool, as represented in the figure below.

PINs have remained fairly consistent overall, with a slight increase since last period. Improvement notices grew steadily from 2011-12 to 2017-18 and then dropped until 2020-21 before increasing again in 2021-22. 2022-23 was a slight decrease from the previous year.

Improvement notices

Improvement notices are utilised by local governments to address a variety of non-compliances within a food business. This may include issues such as the need to remedy cleaning, maintenance or structural contraventions or unsafe food handling practices. Improvement notices must provide food businesses with a reasonable timeframe to remedy any stated non-compliance.

Improvement notices remain as the most utilised method of enforcement. The number of improvement notices issued in this reporting period (2,834) is similar to 2022-23 (2,908).

Prescribed infringement notices

Prescribed infringement notices (PINs) may only be issued for offences that fall within the guidelines for eligible offences that have been acknowledged as PIN offences under the State Penalties Enforcement Regulation 2014. Only certain offences under the Food Act have been prescribed as PIN offences.

PINs can be issued when offences pose a moderate threat to human health and safety, or where there are indications of previous, current and ongoing non-compliance, such as failure to comply with a licence condition (section 51(1)) or failure to comply with the Food Standards Code (section 39(1)). The penalty unit values for PINs are relative to the severity of the offence.

While the issuing of PINs remains the second most frequently used type of enforcement activity, the number of PINs issued within the 2022–23 reporting period (486) increased by 15% from 2022–23 (421).

The annual trend in relation to other enforcement activities undertaken by Queensland local governments are shown in the figure below.

All activities remained consistent with 2021-2022.

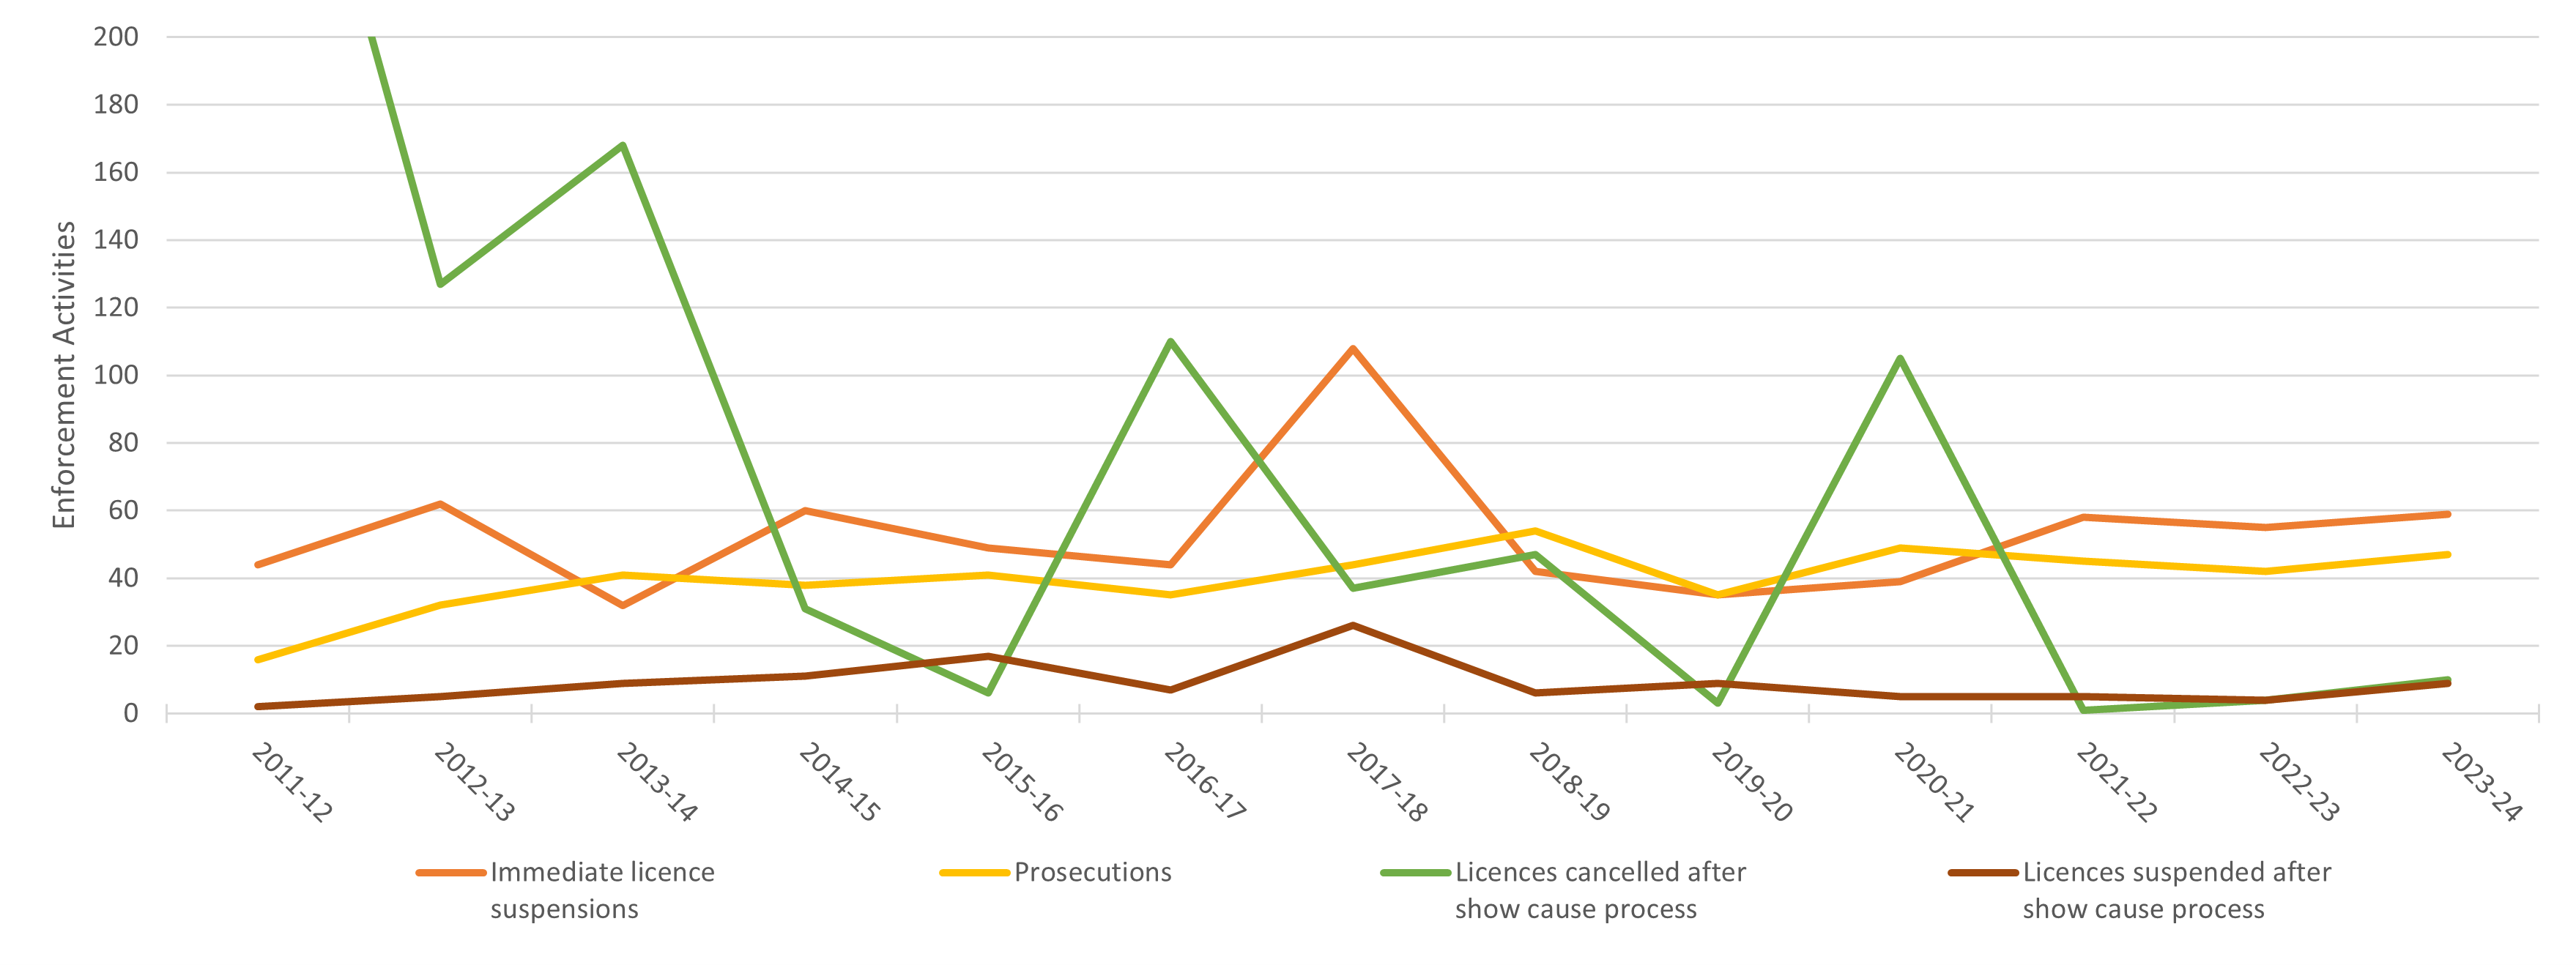
Suspension and cancellation of a licence

Section 78 of the Food Act allows local governments to suspend or cancel a licence when the licensee:

  • is not, or is no longer, a suitable person to hold a licence
  • has not complied with the accredited food safety program and the non-compliance is likely to result in a high risk to public health or safety
  • has a licence issued under false or misleading representation.

Licences can be suspended or cancelled following a show cause notice. Local governments can use the show cause notice provisions prior to taking proposed action such as suspending or cancelling the licence.

A total of 94 show cause notices were issued during this reporting period, resulting in nine licence suspensions and ten cancellations.

Licences may be immediately suspended if a ground exists to suspend or cancel the licence and it is necessary to suspend the licence immediately because there is an immediate and serious risk to public health or safety.

During this reporting period, there was a total of 59 immediate licence suspensions, 61% (36) of which were issued by Brisbane City Council.

The number of food businesses that surrendered their licence was 641, 42% more than in 2022–23 (453).

Seizures

An authorised person has the power to seize a thing under the Food Act in certain circumstances, for example as evidence of an offence under the Food Act. A total of two seizures were undertaken in 2023–24, consistent with the past three reporting periods.

Prosecutions

Prosecutions are usually initiated if there is a high threat to human health and safety, or if there is a known or expected ongoing non-compliance. Consequently, prosecutions are the least common, most resource-intensive enforcement tool utilised by local government.

For this reporting period, a total of 47 prosecutions were undertaken, all of which were undertaken by Brisbane City Council.

Most local government employees working in food regulation are environmental health officers (EHOs). It is important to note that EHOs are responsible for many areas in addition to food regulation, particularly those in rural and remote locations.

In some rural and remote areas, food regulation is carried out by contract EHOs employed on an as-needs basis. In some of the Indigenous communities, environmental health workers may fulfil this function as part of their duties. To support Aboriginal Shire Councils and to build the skills of environmental health workers, EHOs from local Public Health Units often provide advice on food safety issues and inspecting food businesses operating within the area.

Statewide, there were approximately 163 employees committed to food regulation for the 2023–24 reporting period, which is an 18% decrease from 2022–23 (198).

A total of 41% (29) of local governments with licensed food businesses reported that they use contractors. This is a small decrease from 2022–23, where 43% (31) of local governments with licensed food businesses used contractors to perform some food regulation tasks.

Employees committed to food regulation

The number of persons employed in food regulation increased since 2021-22.

Results presented in this report indicate that local governments are effectively administering their devolved powers under the Food Act 2006.

Licensed food businesses continue to have high rates of compliance with legislated requirements. The number of licensed food businesses in Queensland was 32,916, similar to 2022-23 (31,790 businesses).

A total of 75% (50) of local governments with at least one licensed food business reported that all licence application received were processed in accordance with legislated requirements including timeframes.

A total of 24,147 routine inspections conducted in the 2023–24 reporting period for licensed food businesses means that annual inspections are undertaken for only three-quarters of licensed food businesses, although this does not include re-inspections or complaint-related inspections.

Since 2018-19, complaints received annually about food businesses have been steadily increasing. During this reporting period, 5085 complaints were received, which is an increase of approximately 19% from 2022–23 (4,281). Data relating to complaints against food businesses that do not require a licence is collected by 47% of local governments.

Compared to the previous reporting period, there was a significant decrease in the lower number of full-time equivalent employees and a small decrease in the number of local governments using contractors committed to food regulation. Generally, contractors are employed for short periods at a time, which limits the capacity of the local government to perform food regulatory functions regularly or in a timely manner (e.g. responding to complaints).

A realistic aspiration of a food regulatory system is to ensure that a food business is subject to the same amount of regulatory scrutiny and enforcement, whether in a major city or a remote area. The key to ensuring consistency is inspection frequency. It is reasonable to anticipate that inspection frequency should be based on risk, including compliance history, with high-risk businesses inspected more regularly than lower risk businesses.

However, inspection data captured in this report does not provide the discrimination necessary to compare regulatory oversight between local governments. To do so requires inspection numbers to be provided for non-licensed food businesses and to be based on a universal definition for risk and a specified frequency for each risk level.

This will require a change in how local governments categorise food businesses. To note, data relating to complaints against food businesses that do not require a licence is collected by only 47% of local governments.

Despite any identified constraints, this report allows local governments to broadly compare their results with those of other local governments with similar remoteness, numbers of licensed food businesses and numbers of persons committed to food regulation.