Electric vehicle snapshot November 2021
Battery Electric Vehicles (BEVs)
Battery electric vehicles registered in Queensland
As at 31 October 2021
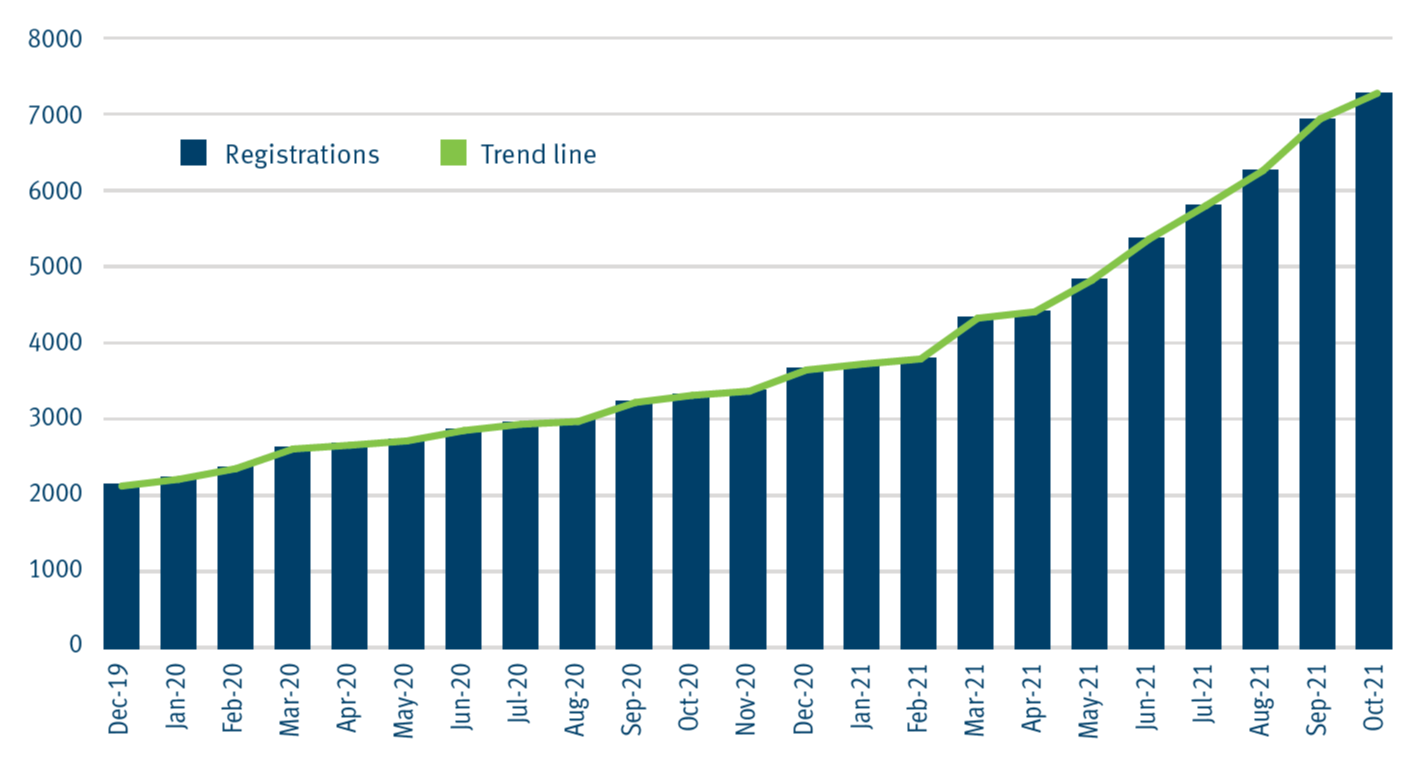
Registered battery electric vehicles include passenger cars, light vans, motorcycles, buses and trucks. Registration data includes private ownership, commercial fleet, and commercial dealership registrations.
Registrations
Trend line
This graph shows the number of battery electric vehicles registered in Queensland from December 2019 to Oct 2021.
| Month | Number of battery electric vehicles registered |
|---|---|
| December 2019 | 2,115 |
| January 2020 | 2,201 |
| February 2020 | 2,337 |
| March 2020 | 2,588 |
| April 2020 | 2,636 |
| May 2020 | 2,691 |
| June 2020 | 2,824 |
| July 2021 | 2,904 |
| August 2020 | 2,939 |
| September 2020 | 3,182 |
| October 2020 | 3,273 |
| November 2020 | 3,326 |
| December 2020 | 3,597 |
| January 2021 | 3,673 |
| February 2021 | 3,737 |
| March 2021 | 4,258 |
| April 2021 | 4,339 |
| May 2021 | 4,743 |
| June 2021 | 5,266 |
| July 2021 | 5,695 |
| August 2021 | 6,143 |
| September 2021 | 6,801 |
| October 2021 | 7,129 |
Suburbs with most Battery Electric Vehicles (BEVs) registered (passenger cars)
| Suburb | Number of BEVs (passenger cars) |
|---|---|
| Brisbane City | 105 |
| Southport | 96 |
| Surfers Paradise | 79 |
| Hope Island | 74 |
| Fortitude Valley | 68 |
| All others | 5,772 |
| Total passenger BEVs | 6,194 |
| Total BEVs | 7,129 |
EV fleet penetration: 0.16%
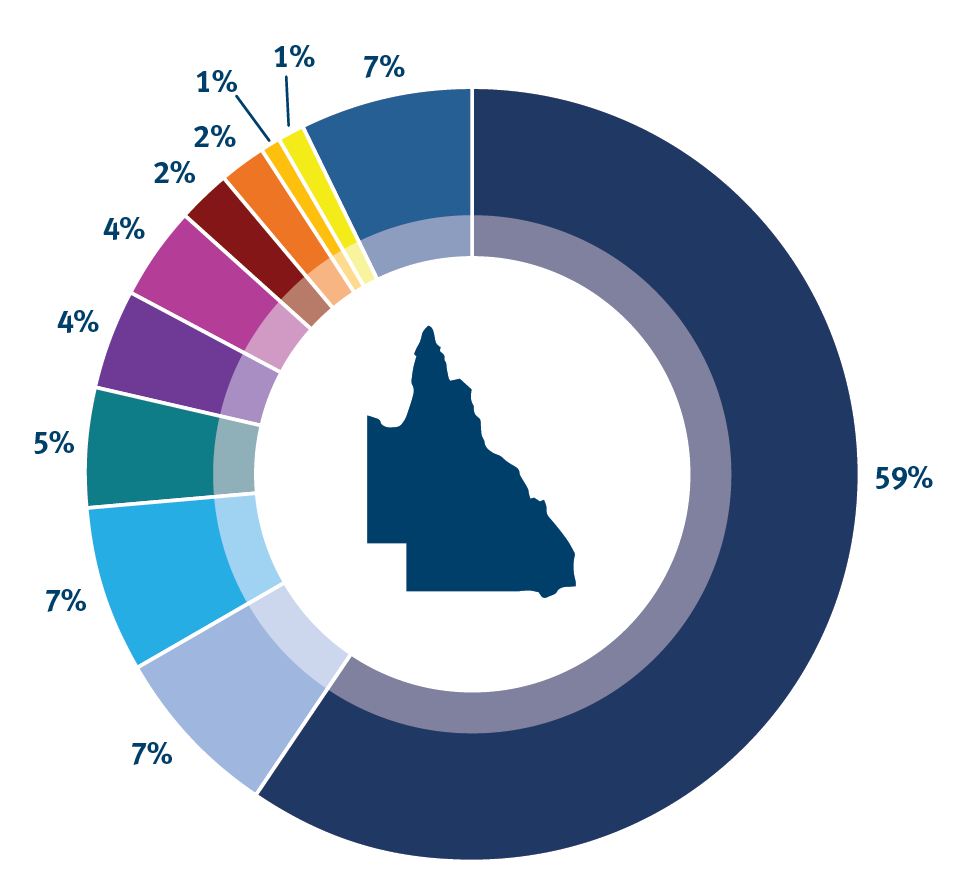
Battery models registered in Queensland (passenger cars)
Tesla 3
Tesla S
Nissan Leaf
Tesla X
MG ZS EV
Hyundai Kona
Hyundai Ioniq
Mercedes EQ C400
Mercedes EQA 250
Porsche Taycan
All others
This graph shows the percentage of battery electric vehicle models (passenger vehicles) registered in Queensland as of 31 October 2021.
| Model | % Registered* |
|---|---|
| Tesla 3 | 59 |
| Tesla S | 7 |
| Nissan Leaf | 7 |
| Tesla X | 5 |
| MG ZS EV | 4 |
| Hyundai Kona | 4 |
| Hyundai Ioniq | 2 |
| Mercedes EQ C400 | 2 |
| Mercedes EQA 250 | 1 |
| Porsche Taycan | 1 |
| All others | 7 |
* Please note: these values are rounded to whole numbers and may not total to 100%.
Queensland Electric Super Highway
Yurika own and operate all fast charging stations along the Queensland Electric Super Highway.
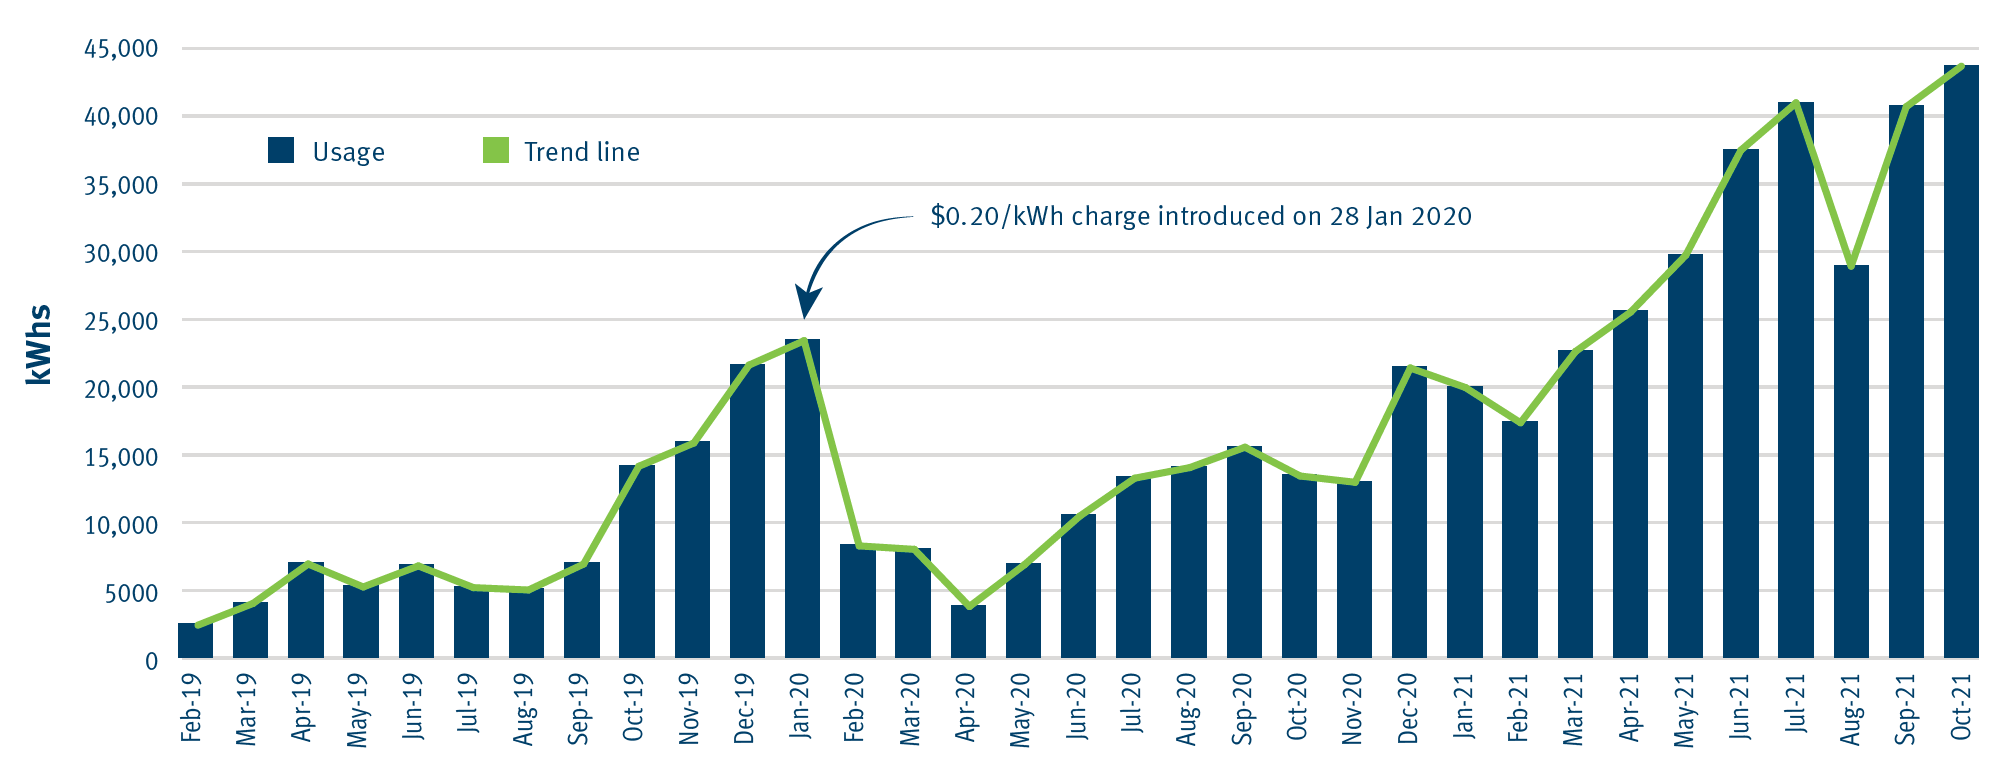
Usage
Usage
Trend line
This graph shows the number of kilowatt-hours used along the Queensland Electric Super Highway from January 2018 to October 2021.
A $0.20/kWh charge was introduced on 28 January 2020.
| Month | kWhs |
|---|---|
| January 2018 | 2,199.66 |
| February 2018 | 1,681.74 |
| March 2018 | 2,350.05 |
| April 2018 | 2,761.76 |
| May 2018 | 2,483.36 |
| June 2018 | 2,745.05 |
| July 2018 | 2,340.67 |
| August 2018 | 4,246.10 |
| September 2018 | 3,332.92 |
| October 2018 | 3,702.30 |
| November 2018 | 4,638.39 |
| December 2018 | 2,948.07 |
| January 2019 | 3,231.52 |
| February 2019 | 2,568.03 |
| March 2019 | 4,202.28 |
| April 2019 | 7,162.22 |
| May 2019 | 5,437.89 |
| June 2019 | 7,018.79 |
| July 2019 | 5,388.92 |
| August 2019 | 5,210.10 |
| September 2019 | 7,163.24 |
| October 2019 | 14,501.00 |
| November 2019 | 16,256.40 |
| December 2019 | 22,102.89 |
| January 2020 | 23,941.00 |
| February 2020 | 8,523.82 |
| March 2020 | 8,263.00 |
| April 2020 | 3,970.00 |
| May 2020 | 7,112.78 |
| June 2020 | 10,754.05 |
| July 2020 | 13,609.00 |
| August 2020 | 14,407.00 |
| September 2020 | 15,935.00 |
| October 2020 | 13,774.00 |
| November 2020 | 13,302.00 |
| December 2020 | 21,888.00 |
| January 2021 | 20,422.00 |
| February 2021 | 17,774.00 |
| March 2021 | 23,134.00 |
| April 2021 | 26,093.00 |
| May 2021 | 30,365.00 |
| June 2021 | 38,250.00 |
| July 2021 | 41,805.00 |
| August 2021 | 29,543.60 |
| September 2021 | 41,512.26 |
| October 2021 | 44,556.70 |
Popular fast-charging stations
| Suburb | kWh Usage | %* |
|---|---|---|
| Hamilton | 90,706.10 | 15% |
| Helensvale | 44,016.81 | 7% |
| Coolangatta | 39,959.74 | 7% |
| Cairns | 39,413.13 | 6% |
| Springfield | 34,552.56 | 6% |
| All others | 362,553.81 | 59% |
| Total kWh usage | 611,202 | 19% |
* Please note: these values are rounded to whole numbers and may not total to 100%.
Tailpipe emissions saved
704–826 tonnes saved by using Green Energy—equivalent to removing 234 cars off Queensland roads.
Kilometres charged
3,213,428km charged, equivalent to driving around Australia 171 times. Based on an estimated distance of 14,500km to drive around Australia and 1kWh equating to 5–6km travelled.